(this is the second part of the series "Pinterest Analytics - From Strategic Planning to Tactical Measurement". If you haven't read the previous one, I strongly recommend you to go through it first... and no worry, I will wait you here. :) )
The Gateway
 |
| The first step of the cycle always happens on the platform |
I call this step as Platform Engagement Analysis, a stage that allow a strategist to determine if certain piece or group of content, or in our case a pin in Pinterest, can "lure" visitors for more in-depth engagement. By considering interactions including Like, Comment, Re-Pin, and Follow as the key micro-conversions, one could easily tell how good their content are performing in terms of driving reader from impression to interaction, and thus pushing forward in our top-level conversion cycle.
"Yeah i know, simply count these metrics and record on the spreadsheet, why bother so much on the strategy?" Bob said.
No Bob, strategy matters. Metrics are just number when proceed without cautions. :\
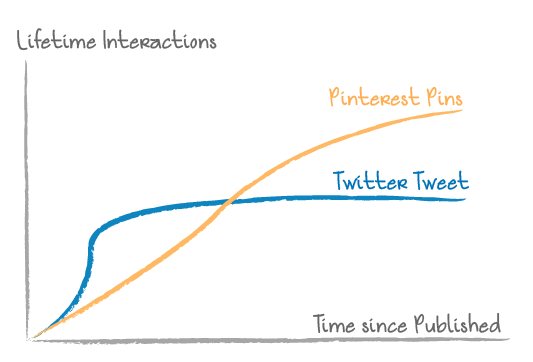
As Ben Silbermann, co-founder and CEO of Pinterest, shared on SXSW, “You'll never see a tweet older than 48 hours, unless it’s ironic. I wanted to create a service that’s a bit timeless.” (read more at AllThingsD). Pins on Pinterest doesn't aim to provide news discovery, rather than this, they aim to let people discover the beauty that bury under timeline. In other words, contents on Pinterest should be expected to provide Lifetime value rather than short term buzzes.
 |
| Each Platform is unique, so does the Strategy and Analysis. |
Sure our dearest student Bob is correct in using Lifetime Like and Comments as one of key metrics, yet does such metric really tell the Lifetime value in a continuous basis?
A better approach for this would be considered "Average Daily Interactions (since Published)" (or ADI), in this way, we could easily tell if a Pin is effectively present on Pinterest as time passes: should a Pin provide good Lifetime value, its ADI would be steady and remain high, otherwise, it drops as time goes.

To simplify our calculation, consider summing all Likes and Comments as Interactions would be sufficiently helpful. Personally, i would take Leftime Re-Pin and Avg. Daily Re-Pin as a separate metric as the value of Re-Pin should be much higher than Likes & Comments: not only it actually create additional access point (for awareness) on other users' Board, it's also an indicator for people who has been pushed forward in the cycle but before actual click-through (e.g. Re-Pinning a dress as "My Collection"), thus represents an additional stage on how people goes through the cycle.
Tips to Marketers: Always algin your content strategy with the platform's vision. Pinterest focuses in timeless discovery, so publish something with a beauty that lasts; Facbook focuses in Fans, so treat the one who liked your page like a VIP, they should be your loyal customers; Twitter focuses in news and conversation, so have someone in your team to engage on Twitter in real-time !!
Number of Follow would be more "Profile" level, so a Lifetime Follow would act much similar to "FanPage Likes" on facebook, which could be used as a health check for the profile.
 |
| Time to expand the original spreadsheet... |
That should have abstracted everything happened on Pinterest platform. Following the cycle we have described, the next micro-conversion is "Click on Pin".
The Bridge to the Heart
 |
| Bridging information from one platform to another is indeed, an art. |
"Clicks" are good indicator on "content effectiveness", and marketers always focus the Click-Through-Rate (CTR) on almost everything (honestly, we all do, right? XD). What makes this action so important is that not only it demonstrates the transition of visitor from one stage to another, click-through can actually carry information from platform to platform.
 |
| Basic of the basic: Referral Traffics from Pinterest to specific page. |
Slice and dice the on-site data based on Referral Traffics is the basic and easiest way to provide you insights on how people form Pinterest engage on your site. All the basic metrics, PageView/Visit, Avg. time on Site and Bounce Rate could all help you understand how relevant your Pins are linking to the content of your site. Remember to segment the Pinterest traffics based on landing pages (i.e. using Landing Page as "Secondary Dimension" as shown above) in order to provide you a "proper view".
But hey Dickson, tell me something i don't know!!
I am glad that you have asked (please do so even you don't.... :p). The idea of this step is "bridging", that means, linking the data from one platform to another. Remember the spreadsheet that we've prepared? Let's welcome our old friend, the URL Builder, to help us to achieve this task.
First, use URL Builder to tag source & medium as "&utm_source=pinterest" and "&utm_medium=social", this step should be pretty easy. Next, based on the characteristics that we have defined for each content, we create an unique campaign id for the utm_campaign tag.
 |
| The campaign id looks a bit clumsy... but it stores lot of information! |
Here's an example, based on Category, Sub-Cat, Sub and the Content (image file name in this case), we combine everything together and create an unique URL-safe campaign id for each piece of content. So each URL will be tagged like the following:
http://idea-stack.com/i_am_a_landing_page.php?If you have been using URL tagging intensively, then you should already figure what i am planning to do, and indeed, benefit of this approach is three-folded:
&utm_source=pinterest
&utm_medium=social
&utm_campaign=Catalog-Style-Dresses-dress_2_img_0
1. Instead of visiting Referral Report this time, you can go to "Traffic Source > Sources > Campaigns" to view the break down by Campaign. Quickest and easiest way to report the performance of each piece of content
2. With the intensive tagging we have applied, one could easily gather the performance of group of contents by typing the corresponding keywords in the filter and read the overall statistics at the top. (e.g. type "-Style-" to view only content in this group)
3. the most important one, by visiting the Custom Report, one can export all the raw data, and plug it back to the spreadsheet for cross platform analysis!!
 |
| Make sure to use only RAW metrics (e.g. use Entrance with Bounces instead of Bounce Rate) !! |
As long as the custom URLs are settled, we could now bridge each Pin with their corresponding on-site data using their unique campaign id.
We have the engagement metrics, we also have the on-site metrics, the only thing left is linking everything to the dollar signs.
Next, we will be reaching our last part to the journey.... trust me, you don't want to miss it.
Continue to Part III >

Strategic plans should be more than blueprints of previous organizational direction or exercises in writing mission and vision statements. They should provide a framework for decision making within an environment that is more dynamic and competitive than ever before.
ReplyDeleteAccording to Stanford Medical, It's indeed the SINGLE reason women in this country get to live 10 years longer and weigh an average of 19 KG lighter than we do.
ReplyDelete(And actually, it has totally NOTHING to do with genetics or some hard exercise and absolutely EVERYTHING around "HOW" they eat.)
BTW, What I said is "HOW", and not "what"...
TAP this link to find out if this easy quiz can help you discover your real weight loss possibility